

In an age of information overload and complex global challenges, diagrams have emerged as essential navigational tools for human understanding—yet their power is anything but new. In fact, these visual thinking frameworks are five times older than written language, evolving from Stone Age cave markings to today’s interactive data visualisations. This enduring 15,000-year lineage of diagrammatic thinking offers crucial solutions and innovative insights across the realms of science and arts.
Active Tools for Understanding and Innovation
Diagrams bridge the gap between abstract thought and visual representation. One of the earliest known diagrams made by humans is on a stone tablet discovered in Abauntz Cave in Spain, dating to around 13,600 BCE. The stone tablet features a sophisticated topographical diagram depicting the local terrain, waterways, and wildlife of the valley. It goes beyond the mere recording of physical features by suggesting temporal and strategic elements through the tactile representation of paths, hunting grounds, and herd movements.
This relic reveals a fundamental truth about diagrams: they serve not just as passive recordings but as active tools for understanding and innovation. As diagrams have evolved from cave walls to digital interfaces, they have developed into distinct patterns of creation that cross the boundaries between scientific and artistic practice.
Scientific and Artistic Dimensions of Diagramming
By observing the striking similarities between the diagrams found in scientific laboratories and those created in contemporary art practice, we can understand how diagrammatic thinking shapes knowledge production in both fields, and thus develop a framework for analysing these visual tools. By examining how artists and scientists create and utilise diagrams, we have identified four distinct but overlapping approaches to diagram-making:
1) Generative diagrams: These serve as dynamic tools for creative experimentation and discovery. Scientists visually brainstorm ideas to explore hypotheses and model possible solutions, just as artists such as Nikolaus Gansterer and Julie Mehretu use them to generate new visual and conceptual possibilities. In both cases, the act of mark-making becomes a form of thinking, as ideas are dynamically reconfigured to generate new insights.
2) Reductive diagrams: Both scientists and artists often create images that reflect what Roland Barthes called ‘an aesthetics of bareness and sacred simplicity’, indicating that the images are stripped to their essential elements. While scientists add simplicity or reduce complexity to isolate specific variables or relationships, artists such as Yves Netzhammer push this reduction further, creating a stark visual poetry that embodies complex psychological metaphors.
3) Notational diagrams: The systematic elements of scientific notation, such as grids, scales, and axes, appear in both domains. Scientists use them for scientific measurement, while artists like Minjeong An repurpose these conventions to movingly and often comically reframe subjective childhood memories through a lens of objective scientific analysis.
4) Embodied diagrams: Both scientists and artists recognise the role of physical gesture and movement in understanding complex ideas. Scientists often use hand movements to explain molecular interactions or mathematical concepts, while artists such as Mariella Greil make this embodied understanding explicit, treating the body itself as a diagrammatic tool for exploration and communication.
A Poetics of Science: Practice-Based Research
The abovementioned four approaches to diagram-making converge in contemporary artistic practice, and were demonstrated in an exhibition I curated, ‘A Cabinet of Curiosities: A Wunderkammer for the 21st Century’ held in Hong Kong. The exhibition brought together 40 international artists and scientists, many of whom explore how diagrams shape our understanding of complex phenomena. Several works also demonstrated how diagrammatic approaches can work in combination.
My art installation Perpetual Motion was on display at the Hong Kong exhibition. It includes a specially designed carpet that merges notational and embodied diagrams by transforming Nobel laureates May-Britt Moser and Edvard Moser’s research on grid cells into an intricate geometric pattern. Visitors could physically traverse the installation and experience complex scientific concepts through their bodies. We also arranged for a contemporary dance performance to be staged on this carpet, adding a deeper layer of meaning as the dancers’ movements across the space echoed the neural activity occurring within their own minds, weaving together a dynamic fusion of scientific understanding and bodily experience.
On the other hand, Shawn Pakhin Tang’s art installation Inertia similarly balances scientific precision with artistic interpretation. He removed the hour and minute hands from a clock and replaced the second hands with compass needles, creating a mesmerising visualisation of magnetic fields and temporal cycles. Alternating between chaos and synchronisation, the installation offers both an accurate representation of physical principles and a poetic meditation on time and connection.
Bridging Past and Future: Outcomes and Implications
The examination of the four diagrammatic approaches and their applications in the exhibition setting reveals a fundamental truth: the boundaries between scientific and artistic diagramming are far more permeable than traditionally acknowledged. This finding has important implications for the future of visual thinking.
Digital technologies have not only transformed the way we create diagrams, but also expanded what they can represent. Interactive visualisations allow us to explore multidimensional datasets, while augmented reality enables us to overlay diagrammatic information onto the physical world. As we face increasingly complex global challenges, from climate change to artificial intelligence governance, the integration of these approaches becomes critical. Modern diagram-makers must bridge not only scientific precision and artistic insight, but also human cognition and machine learning, local action and global systems, past wisdom and future possibilities.
In this way, diagrams continue the journey that began on cave walls—helping us not only to see and understand our world in new ways, but also to imagine and shape its future.
About the author(s)
Michael Whittle is an associate professor of contemporary art in the Department of Arts and Design, Faculty of Arts and Humanities, University of Macau. His interdisciplinary research explores the intersection of scientific and artistic visualisation practices. Prof Whittle was originally trained as a biochemist before transitioning to fine art. This dual background informs his approach to visual thinking tools. Prof Whittle holds an MA in Sculpture from the Royal College of Art in London, and a PhD in Sculpture as a Japanese Monbusho Research Scholar at Kyoto City University of Arts, where his dissertation focused on diagrammatic thinking in contemporary art practice.
Text: Michael Whittle
Photo: Michael Whittle, Pilar Utrilla
Source: UMagazine ISSUE 31
Academic Research is a contribution column. The views expressed are solely those of the author(s).
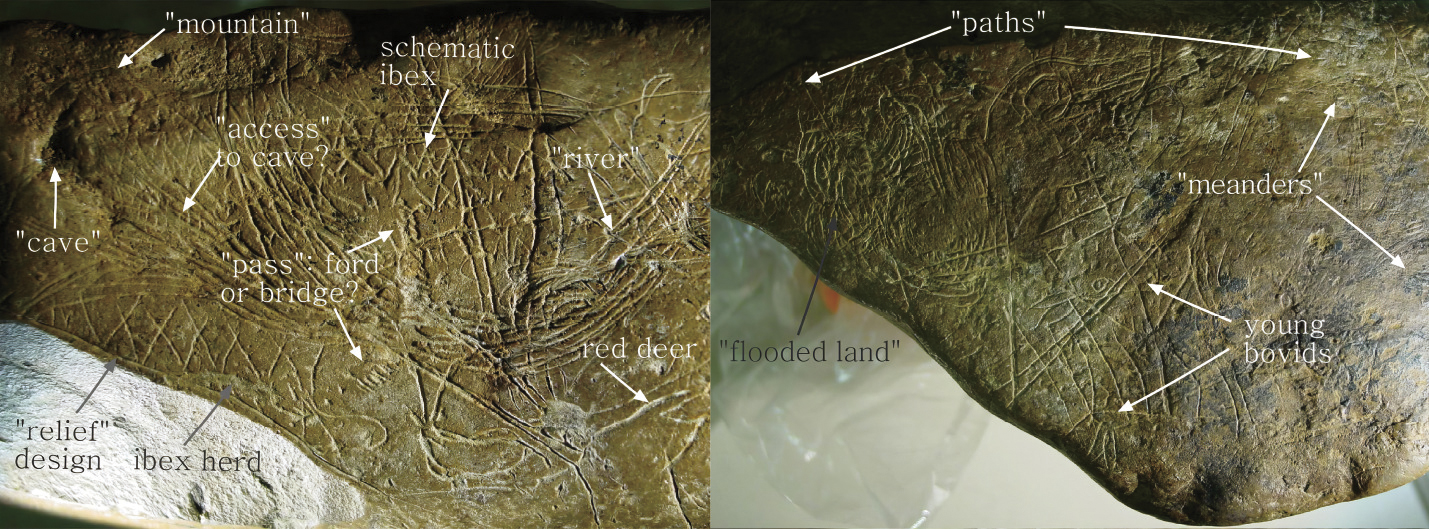
One of the earliest known diagrams made by humans is on a stone tablet discovered in Abauntz Cave in Spain

A dancer performs on the art installation Perpetual Motion, adding a deeper layer of meaning to a dynamic fusion of scientific understanding and bodily experience.
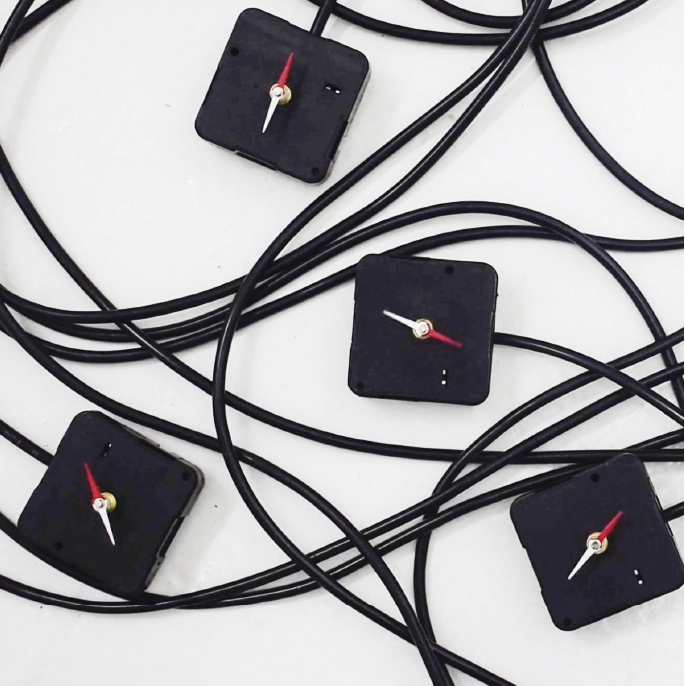
The art installation Inertia balances scientific precision with artistic interpretation