70% students go to polls
Anges Vong, Athena Kong, Gary Song, Gloria Si
Tou
A survey conducted by the UMac Bridges research team indicates that ?? percent of students surveyed in UMac went to the polls in the election for the second Legislative Assembly on September 23.
The survey, carried out between October and November, one month after the election, exhibits both encouraging and disappointing signs of students' attitude towards politics. On the one hand, 70 percent of the registered voters in UMac participated in the election. On the other hand, about 35 percent of students who are eligible voters did not even bother to register.
A total of 100 classes were randomly selected from the five faculties in UMac to be given the questionnaires, out of which 32 classes refused to participate. Together 919 valid questionnaires were collected, which made up for 36.4 percent of the total number of students in UMac. Some major findings are summarized in the following paragraphs.
70 percent registered voters vote
About 70 percent of registered voters cast their votes. The top reason (63.8 percent) for voting is that they think it is the citizens' right to vote. About 13 percent voted due to the influence of families and friends.
The survey also shows that 53.8 percent of students made their choice based on candidates' performances while 19.3 percent based on candidates' plans and social strata they represent. Only 1.5 percent voted under the influence of mobilization by political parties.
All these point to the fact that UMac students are quite mature to make their independent choices without much mobilization by political parties. The high voting rate demonstrates students' increasing concern about Macao's economy and their interest to engage themselves in Macao's politics.
Reasons for non-participation
The reasons for students not to register themselves as voters vary. Answers to the question "why not register" fall into three main clusters, with 29.8 percent responding "no interest," 19.9 percent "no time" and 18.5 percent saying they "do not understand the issues."
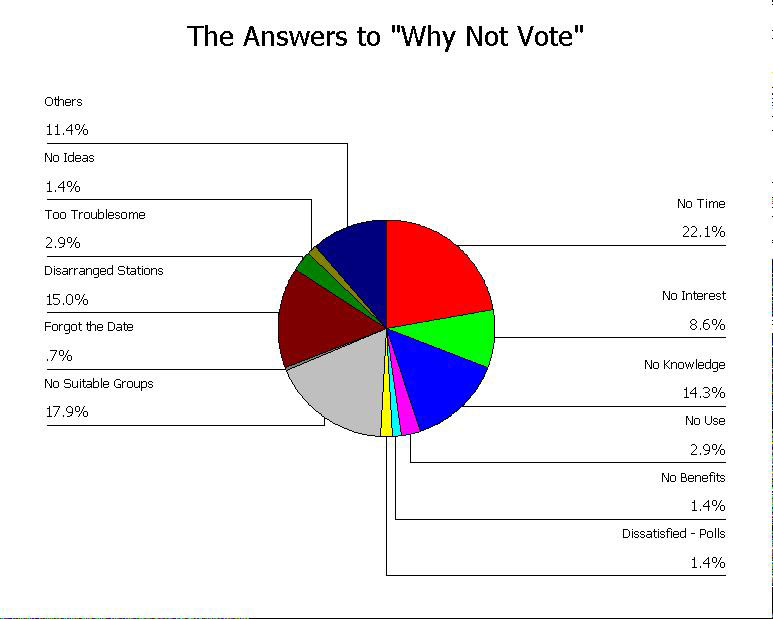
The top reason for students who had registered in the election, but failed to vote was that they "do not have time" to vote (22.1 percent). About 15 percent responded that was due to "disarrangement of voting stations." It is noteworthy to look at the excuse of "no time." In fact the government devoted a great deal of effort to make it simple and convenient for people to vote. Besides, the voting took no more than five minutes. It is obvious that those who failed to vote didn't see the point to spend a little bit of time to get involved in political affairs.
Other reasons are related to a lack of information and knowledge about candidates. About 17.9 percent answered that they did not vote because they "do not see a satisfactory candidate" and 14.3 percent said they have "no knowledge" (Figure 1). Students might be more likely to vote if they know more about candidates. As they had limited knowledge of candidates, they just didn't want to make an uneducated vote.
Feeling powerless in politics
While 37.5 percent of respondents agree with the statement that every vote counts and individual citizens can make a difference in government policy change, more students (41.8 percent) think that even though they become involved, they could do very little to change the situation. And 14.3 percent even believe that politics is a game played simply by a 'small circle' of people.
Even though students' opinions on politics are a bit cynical, most of them still try to be involved and to make changes. It is interesting to note that students who deem politics as simply a 'small circle' activity register a high turnout rate of 74.6 percent in the election.
Limited knowledge about the election
Despite students' high turnout rate, students demonstrate very little knowledge about the election.
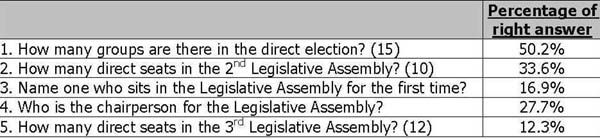
Only 16.3 percent of students said that they are constantly aware of the election news and 57.8 percent of them are sometimes aware of the news. But as the election knowledge is concerned, they all scored poorly. Only 50.2 percent gave a correct answer to the question of how many groups participated in the direct election this year although this information had been publicized again and again in the local media before the election.
Regarding the question about how many direct seats would be in the third Legislative Assembly. Only 12.3 percent answered it right. It is noteworthy that 33.8 percent of FLL students got it right while only 2.2 percent of FBA students had a correct answer. This might be a result of the fact that FLL students care more about politics.
Seldom talk politics in class
How often and with whom do students discuss politics? Only 3.9 percent of those surveyed claimed that they always discuss it with their peer group, while 34.7 per cent said they sometimes do so. About 5.4 per cent said they constantly share the issue with their families while 40 per cent said they do so sometimes. However, 40.8 percent of the students said they seldom discuss politics with their teachers. And 43.2 percent claimed they have never talked about it in class.
The older you are, the more likely you would be to vote
The survey also demonstrates some linkage between age and voting. The older a student is, the more likely he/she would be to vote. Among the age group of 18-21, 67.8 percent of them went to vote, whereas the voting rate is 74.7 in the age group of 22-25. For the age groups 26 to 30 and 31 or above, the turnout rate is 86.4 percent and 100 percent respectively. It is obvious that students show more concern about politics and the legislation as they grow older.
There is also a slight difference in the turnout rate between male and female students. About 72.8 percent of male students went to vote, compared with 66.8 percent for female students.
Interviews: