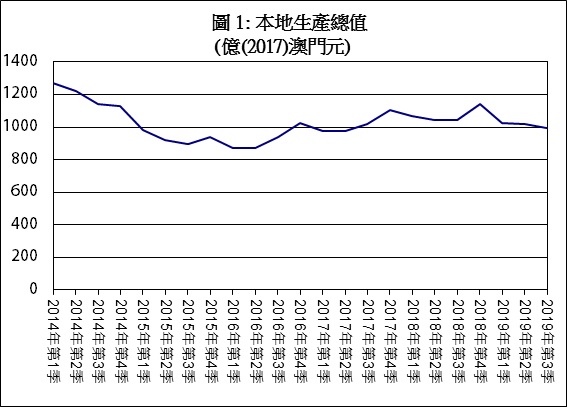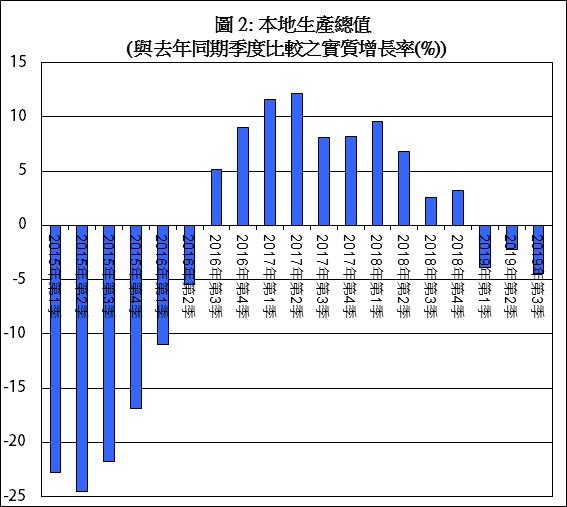

The University of Macau’s (UM) Centre for Macau Studies and Department of Economics today (14 January) held an event to release the 2020 macroeconomic forecast for Macao and an opening ceremony for the Macao Economic Database. Statistics show that Macao’s economy continued to deteriorate in 2019 amid the economic slowdown in mainland China. Negative growth was recorded for three consecutive quarters. The year-on-year growth rates were -3.8% in the first quarter, -2.2% in the second quarter and -4.5% in the third quarter, respectively (Figure 1 and 2).
China and the United States have just signed the ‘phase-one’ trade deal to avoid the escalation of economic tension. However, the underlying disagreement has not been completely resolved. The conflict could reappear in the near future. For China’s domestic economy, faced with debt accumulation and possible real estate bubble, the central government could only try accommodative economic policies cautiously. The economic growth could future subdue. In an uncertain external environment, Macao’s economy is expected to continue to slow down in 2020.
Macao’s Recent Economic Situation
The following statistics highlight the recent economic situation of the different sectors of Macao’s economy:
· With the slowdown in China’s economic growth, Chinese visitors’ spending in Macao, especially spending on gaming activities, weakened. The exports of services were recorded at MOP 80.4 billion in the third quarter of 2019, down by 4.7% year-on-year. Meanwhile, the exports of services in gaming, the largest portion of the exports of services, were MOP 53.7 billion, down by 4.2% year-on-year.
· In the third quarter of 2019, the nominal gross gaming revenue was MOP 70.8 billion, down by 4.1% year-on-year, or 3.5% quarter-on-quarter. Revenue from the VIP baccarat was MOP 31.1 billion, down by 22.5% year-on-year, or 10.2% quarter-on-quarter.
· In November 2019, total visitor arrivals were 2.91 million, down by 10.9% year-on-year. Visits from mainlanders were 2.03 million, down by 11.1% year-on-year and visits from Hong Kong were 0.57 million, down by 3.4% year-on-year.
· Exports of goods recovered in the third quarter of 2019. It increased by 0.5% year-on-year to MOP 3.2 billion.
· For the third quarter of 2019, the imports of goods rose by 1.6% year-on-year to MOP 25.8 billion. Imports of services recovered and increased by 2.1% year-on-year to MOP 9.4 billion.
· In terms of the imports of goods, consumer goods increased by 4.0% year-on-year in the third quarter of 2019 amid a steady growth in consumer spending. Meanwhile, raw material and semi-manufactures fell by 11.7% year-on-year. Capital goods decreased by 24.9% year-on-year amid the decline in investment.
· With stable earnings, Macao residents’ spending grew modestly. Private consumption expenditure was recorded at MOP 26.2 billion in the third quarter of 2019, up by 2.8% year-on-year. Household final consumption expenditure in domestic market and overseas expenditure increased by 2.5% and 3.4% year-on-year, respectively.
· Private gross fixed capital formation continued to decline amid the completion of major new hotels and casinos. It was recorded at MOP 10.4 billion in the third quarter of 2019, down by 21.9% year-on-year. Meanwhile, government gross fixed capital formation recovered and increased substantially by 84.3% year-on-year. As a result, total gross fixed capital formation decreased by 8.5% to MOP 14.0 billion. Private construction investment declined by 26.3% and private equipment investment grew by 1.7% year-on-year respectively.
· Real estate transaction cooled down modestly in the third quarter of 2019. The total number of residential units purchased and sold was 2,342, amounting to MOP 14.2 billion, down by 14.1% and 15.7% quarter-to-quarter respectively. 214 residential units were sold for over MOP 10 million; 1,473 units were sold for between MOP 4 million and under MOP 10 million; 533 units were sold for between MOP 2 million and under MOP 4 million; and 158 units were sold for MOP 2 million or less. As regards the floor area of residential units, 958 units (40.9% of total) had an area of 50 to 99.9 square meters. The average per square meter transaction price of the residential units went down by 0.3% quarter-to-quarter to MOP 109,977. The average per square meter transaction price of the residential units with an area of 50 to 99.9 square meters registered an increase of 0.8% quarter-to-quarter to MOP 102,612 .
· Inflation rate held steady amid slower demand from residents. However, pork price is a concern amid swine fever in mainland China. The Composite Consumer Price Index-November 2019 rose by 2.7% year-on-year. The year-on-year growth rates of the two largest components of the Composite Consumer Price Index, namely food and non-alcoholic beverages, and housing and fuel, were 5.4% and 1.4% respectively. For the aggregate economy, in tandem with consumer price, the GDP deflator increased by 2.4% year-on-year in the third quarter of 2019.
· Labour market continued to be tight. The unemployment rate for the third quarter of 2019 was 1.8%, up 0.1 percentage point from the second quarter of 2019. Excluding non-resident workers, the unemployment rate for residents was 2.5%, up 0.2 percentage point from the second quarter of 2019.
· The total number of employed people and the number of employed Macao residents were 387,000 and 282,000 in the third quarter of 2019, down by 0.1% and 1.5% year-on-year respectively. By industry, 42,000 people were employed in wholesales & retails, and 57,000 people were employed in hotels & restaurants, down by 3.0% and 0.4% year-on-year respectively. The number of people employed in construction was 30,000, down by 6.0% year-on-year. The number of employees in the gaming industry was 85,000, up by 0.6% year-on-year.
· Median monthly employment earnings registered MOP 17,000 in the third quarter of 2019, up by 6.3% year-on-year. For the gaming sector which accounted for the largest share of the employed population, median monthly employment earnings were MOP 20,000, same as the third quarter of 2018. The median monthly employment earnings for the other major industries such as wholesales & retails were about MOP 13,200, up by 3.1% from the third quarter of 2018, while the median monthly employment earnings for hotels & restaurants were MOP 11,400, down by 5.0% year-on-year.
Macroeconomic Forecast for 2020
In October 2019, the International Monetary Fund (IMF) projected that global economy would grow at a rate of 3.4% in 2020. With a projected economic slowdown in China and the United States and uncertain prospects for European countries, a subdued pace of global activity is expected to happen.
US GDP is expected to increase at a rate of 1.7% in 2020. The Euro Area is likely to grow at a rate of 1.4% in 2020. For China, the official economic growth registered a rate of 6.0% in the third quarter of 2019, down further from 6.2% in the second quarter of 2019. This caused economic growth in Hong Kong, with its political tensions, to contract by 2.9% in the third quarter of 2019.
Macao’s exports of services are expected to contract by 4.3% in 2020. Exports of goods are expected to decline by 6.0% in 2020. Concomitant with the weak growth in consumption and investment, imports of goods are expected to rise slower by 0.1% in 2020. Amid the deterioration in exports of services, the imports of services are expected to decline. The growth rates of imports of services are forecast to decrease by 0.5% in 2020.
For domestic demand, private consumption spending is expected to grow steadily in 2020, at a rate of 2.5%. Total investment is expected to continue to decline in 2020, at a rate of 9.5%.
Inflation rate, as measured by the change in the Composite Consumer Price Index, is expected to hold steady at around 2.6% in 2020. For the aggregate economy, the GDP price deflator is forecast to increase by 2.3% in 2020.
The labour market continues to be tight amid limited labour supply. The unemployment rate is forecast to be 1.9% in 2020. Excluding non-resident workers, the unemployment rate among Macao residents is expected to be 2.6% in 2020. Median monthly employment earnings are forecast to be MOP 16,859 in 2020.
For overall economy, Macao’s GDP is forecast to decline by 3.7% in 2020, ranging from a pessimistic forecast of -12.0% to an optimistic forecast of 4.7%. These forecasts will be updated to reflect the rapidly changing external environment.
About the Macroeconometric Structural Model of Macao
The Macroeconometric Structural Model of Macao is a quarterly simultaneous-equations econometric model which currently covers seven blocks of the Macao economy — consumption, investment, external sector, prices, government, labour market, and monetary sector. It includes 89 equations and 251 variables. Time series data used data from the first quarter of 1998 and is updated once new data become available. Its results provide the community with a timely understanding of the state of Macao’s economy and help decision-makers make prudent choices for the future.
|
Table: Forecasts of Major Economic Variables |
||||||
|
|
2015 |
2016 |
2017 |
2018 |
2019 |
2020 |
|
Level |
(Actual) |
(Actual) |
(Actual) |
(Actual) |
(Forecast) |
(Forecast) |
|
373.4 |
370.7 |
407.3 |
429.5 |
414.6 |
399.3 |
|
|
Private Consumption Expenditure (Billion of 2017 MOP) |
97.5 |
96.7 |
98.9 |
103.0 |
105.6 |
108.3 |
|
Gross Fixed Capital Formation (Billion of 2017 MOP) |
93.5 |
82.3 |
80.3 |
71.9 |
59.0 |
53.4 |
|
Exports of Goods (Billion of 2017 MOP) |
15.5 |
12.4 |
14.0 |
15.8 |
14.6 |
13.7 |
|
Exports of Services (Billion of 2017 MOP) |
268.5 |
266.4 |
311.6 |
341.7 |
332.8 |
318.6 |
|
Imports of Goods (Billion of 2017 MOP) |
106.5 |
93.2 |
99.0 |
106.2 |
106.3 |
106.5 |
|
Imports of Services (Billion of 2017 MOP) |
33.7 |
32.6 |
36.8 |
39.6 |
36.3 |
36.2 |
|
GDP Deflator (2017 = 100) |
97.0 |
97.8 |
99.9 |
103.5 |
106.1 |
108.6 |
|
CPI (Composite) (October 2013-September 2014 = 100) |
105.7 |
108.2 |
109.6 |
112.9 |
116.0 |
119.0 |
|
15,000 |
15,000 |
15,000 |
16,000 |
16,827 |
16,859 |
|
|
Employment (Thousand Persons) |
396.5 |
389.7 |
379.8 |
385.4 |
387.8 |
391.3 |
|
Table (Continued): Forecasts of Major Economic Variables |
|||||||
|
Year-on-Year Growth Rate |
2015 |
2016 |
2017 |
2018 |
2019 |
2020 |
|
|
(%) |
(Actual) |
(Actual) |
(Actual) |
(Actual) |
(Forecast) |
(Forecast) |
|
|
|
Lower |
|
|
|
|
-4.9 |
-12.0 |
|
Gross Domestic |
Baseline |
-21.6 |
-0.7 |
9.9 |
5.4 |
-3.5 |
-3.7 |
|
Product |
Upper |
|
|
|
|
-2.1 |
4.7 |
|
|
Lower |
|
|
|
|
1.8 |
-1.5 |
|
Private Consumption |
Baseline |
2.1 |
-0.8 |
2.2 |
4.2 |
2.5 |
2.5 |
|
Expenditure |
Upper |
|
|
|
|
3.3 |
6.5 |
|
|
Lower |
|
|
|
|
-20.3 |
-24.5 |
|
Gross Fixed Capital |
Baseline |
5.4 |
-11.9 |
-2.5 |
-10.4 |
-17.9 |
-9.5 |
|
Formation |
Upper |
|
|
|
|
-15.5 |
5.5 |
|
|
Lower |
|
|
|
|
-11.2 |
-21.9 |
|
Exports of Goods |
Baseline |
10.2 |
-20.3 |
13.3 |
12.8 |
-7.4 |
-6.0 |
|
|
Upper |
|
|
|
|
-3.6 |
9.8 |
|
|
Lower |
|
|
|
|
-4.3 |
-14.2 |
|
Exports of Services |
Baseline |
-28.1 |
-0.8 |
17.0 |
9.7 |
-2.6 |
-4.3 |
|
|
Upper |
|
|
|
|
-0.9 |
5.7 |
|
|
Lower |
|
|
|
|
-1.6 |
-7.3 |
|
Imports of Goods |
Baseline |
1.0 |
-12.6 |
6.3 |
7.3 |
0.1 |
0.1 |
|
|
Upper |
|
|
|
|
1.7 |
7.6 |
|
|
Lower |
|
|
|
|
-10.0 |
-8.3 |
|
Imports of Services |
Baseline |
1.6 |
-3.2 |
12.7 |
7.8 |
-8.3 |
-0.5 |
|
|
Upper |
|
|
|
|
-6.6 |
7.4 |
|
|
Lower |
|
|
|
|
2.1 |
-0.3 |
|
GDP Deflator |
Baseline |
4.4 |
0.8 |
2.1 |
3.6 |
2.5 |
2.3 |
|
Growth Rate |
Upper |
|
|
|
|
2.9 |
5.0 |
|
|
Lower |
|
|
|
|
2.6 |
1.2 |
|
CPI (Composite) |
Baseline |
4.5 |
2.4 |
1.2 |
3.0 |
2.8 |
2.6 |
|
Inflation Rate |
Upper |
|
|
|
|
2.9 |
4.0 |
|
Median Monthly |
Lower |
|
|
|
|
4.0 |
-5.2 |
|
Employment |
Baseline |
12.8 |
0.0 |
0.0 |
6.7 |
5.2 |
0.2 |
|
Earnings |
Upper |
|
|
|
|
6.3 |
5.6 |
|
|
Lower |
|
|
|
|
1.7 |
1.3 |
|
Unemployment Rate |
Baseline |
1.8 |
1.9 |
2.0 |
1.8 |
1.8 |
1.9 |
|
|
Upper |
|
|
|
|
1.8 |
2.5 |
|
|
Lower |
|
|
|
|
2.3 |
1.8 |
|
Unemployment Rate |
Baseline |
2.5 |
2.7 |
2.7 |
2.4 |
2.4 |
2.6 |
|
(Residents) |
Upper |
|
|
|
|
2.5 |
3.4 |
Source: Centre for Macau Studies
Media Contact Information: Communications Office, University of Macau
Albee Lei Tel:(853) 88228004Kelvin U Tel:(853) 88224322Email:prs.media@um.edu.moUM Website:www.um.edu.mo